This is second blog about Self Service BI and it focuses on delivering self-service BI using Microsoft technologies.
Microsoft BI capabilities are embedded in three different products: SQL Server, SharePoint and Office. In this article, we will focus on Self Service BI capabilities in Office (Excel) and SharePoint.
Excel has always been primary choice for number crunching. Previously, almost every major BI vendor had extensions available for Excel. Microsoft finally realized to use Excel as a primary tool for delivering BI as well as enabling power users to perform ad-hoc data analysis. Following diagram shows various components in Excel which enable self Service BI.
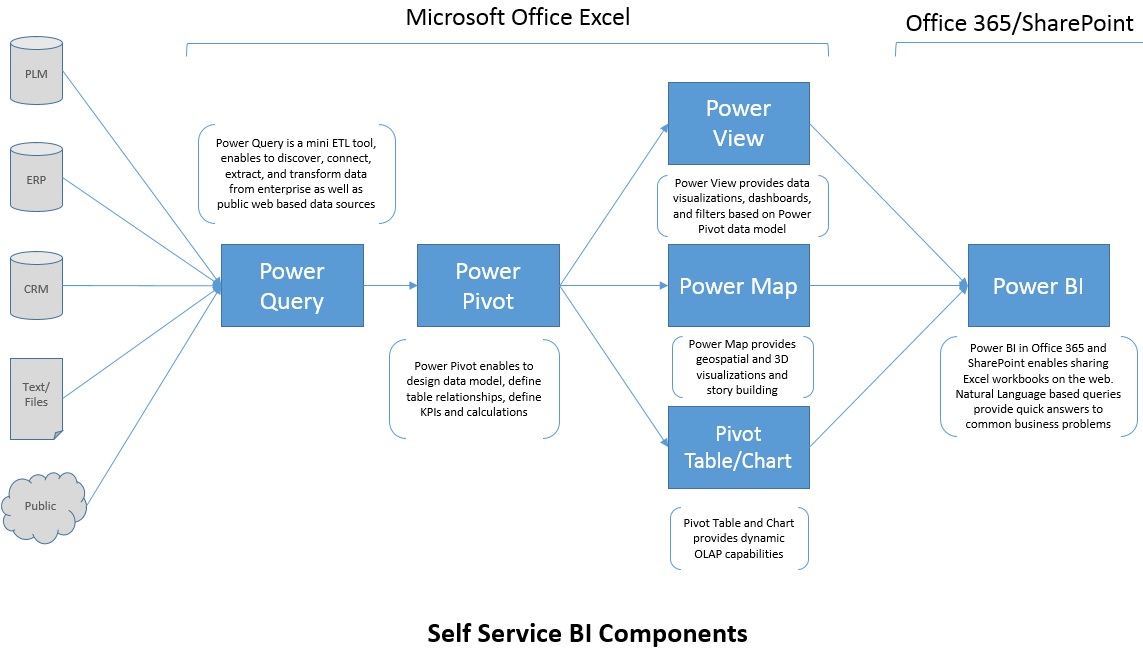
Here is brief description of each tool.
Power Query
Power Query is a mini ETL tool. It enables to discover public as well as enterprise data sources, and then connect, extract, and transform data from these sources. You can perform certain data cleansing operations as well as define new calculated columns. You can also augment enterprise data with public data sources e.g. an insurance company can use car crash data available publically along with their own statistics to see patterns or identify an anomaly. Following screenshot shows options available in Power Query tab.

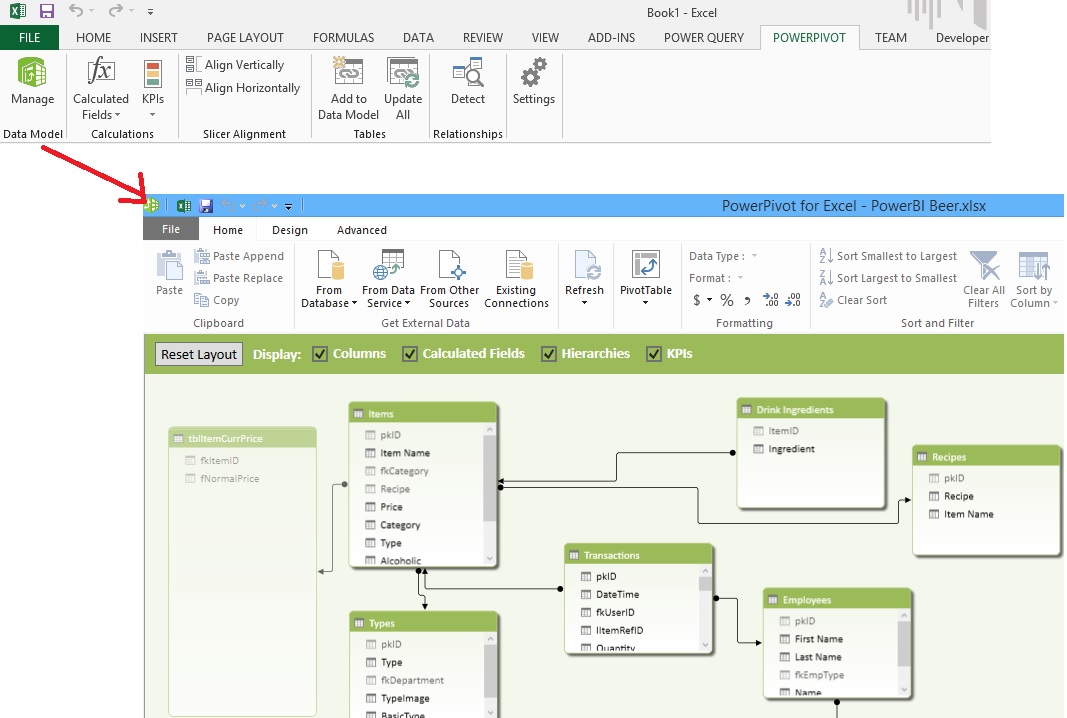
Power Pivot
Once data has been sourced and transformed by Power query, it can be added in Power Pivot data model. Power Pivot enables to combine data from various sources and build data model within Excel. You can define relationships in tables, define new columns, calculate measures using data analysis expressions (DAX). This becomes very handy when you have to combine enterprise data sources with public data sources like data from Azure Data Marketplace. Following screen shot shows Power Pivot designer.
Power View
Once data model has been designed, you can create visualizations using Power View. Power View is built into Excel to create dashboards, containing multiple charts, graphs, tables and filters. User can interact with views to sort, filter and slice and dice information. It eliminates the need to talk to IT to design basic ad-hoc reports for business. Power user can create powerful visualization themselves and share it on the web. Below screen shot shows a power view screen.

Power Map
Power Map provides geospatial and 3D mapping capabilities in Excel. Users can plot data on the map as well as create convincing story boards for presentations.

Power BI
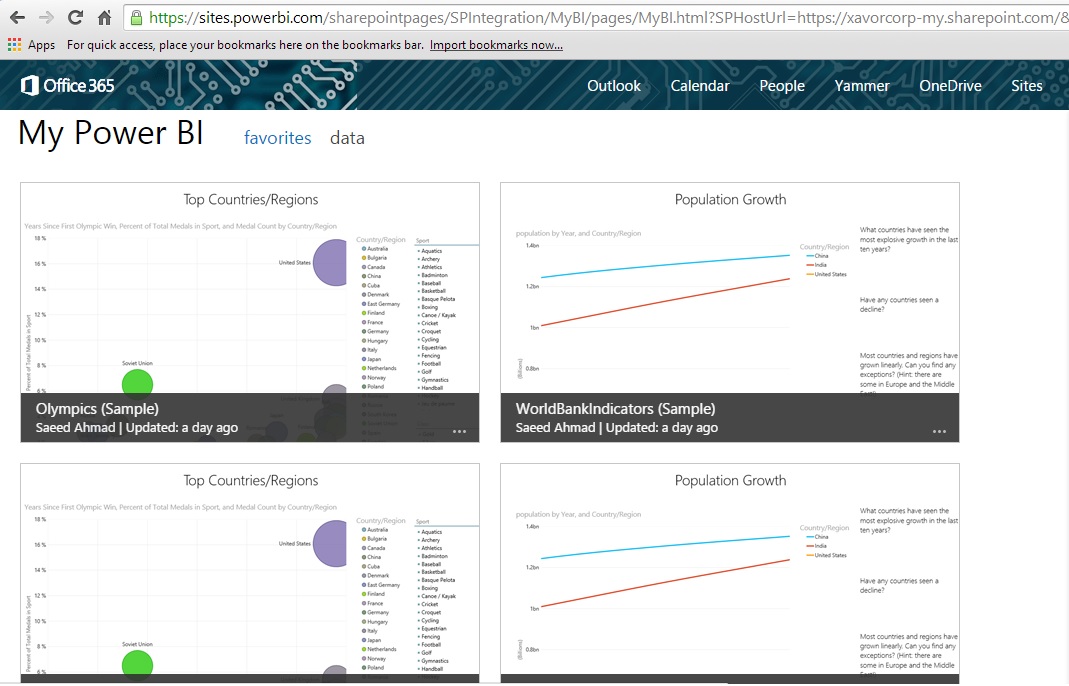
All of the components discussed earlier are built into Excel. Once you have design reports in workbooks, you can use Power BI to share these reports on the web. Power BI also enables to generate natural language queries. Excel Services in SharePoint Online can automatically refresh data by connecting to enterprise data sources. Power BI also provision of My Power BI sites to aggregate reports from various sites as favorites so that you have all the information available at one place.
Windows Power BI App delivers same BI capabilities on mobile devices. Here is how Power BI app delivers BI on mobile devices.

In next part, we can talk about a real life business scenario in retail and see how it can be solved by using self-service BI components.
Note: Few images are taken from publicly available sample workbooks from Microsoft.
For discussion about Self Service BI, click Self Service BI in Microsoft Ecosystem – Part 01.
